 Hastings District
Council
Hastings District
Council
Civic Administration Building
Lyndon Road East, Hastings
Phone: (06) 871
5000
Fax:
(06) 871 5100
WWW.hastingsdc.govt.nz
Open
A G E N D A
Hastings District Rural
Community Board MEETING
|
Meeting Date:
|
Monday,
11 September 2017
|
|
Time:
|
2.00pm
|
|
Venue:
|
Landmarks
Room
Ground Floor
Civic
Administration Building
Lyndon Road
East
Hastings
|
|
Members
|
Chair: Mr P Kay
Mr N Dawson, Mr
M Lester and Mrs S Maxwell
Councillors Kerr and Lyons
|
|
Officer
Responsible
|
Group Manager:
Asset Management – Craig Thew
|
|
Committee
Secretary
|
Christine Hilton (Ext 5633)
|
Hastings District Rural
Community Board – Terms of Reference
The Community
Board is a separate entity to the Council. The role of the Community
Board is set out in Section 52 of the Local Government Act 2002. The
Council is authorised to delegate powers to the Community Board.
Membership
Elected Community
Board Members
Mohaka and
Kahuranaki Ward Councillors appointed by the Council
The Board elects
its own Chairman
Quorum – 4 members
Delegated
Powers
GENERAL
1. To
maintain an overview of services provided by the Council within the Community
Board’s area.
2. To
represent, and act as an advocate for, the interests of the community represented.
3. To
consider and report on all matters referred to the Board by the Council, or any
matter of interest or concern to the Community Board.
4. To
communicate with community organisations and special interest groups within the
community;
5. To
undertake any other responsibilities that are delegated to it by the Council.
6. To
appoint a member of the Community Board to organisations approved by the
Council from time to time.
LONG TERM PLAN/ANNUAL PLAN /
POLICY ISSUES
7. Authority to make a submission to
the Long Term Plan/Annual Plan process on activities, service levels and
expenditure (including capital works priorities) within the Board’s area
or to make a submission in relation to any policy matter which may have an
effect within the Board’s area.
ROADING AND TRAFFIC
8. Authority to
exercise the Council’s powers and functions in relation to roads within
the Board’s area under the following sections of the Local Government Act
1974:
·
Section 335 (vehicle
crossings);
·
Section 344 (gates and
cattle stops);
·
Section
355 (overhanging trees).
9. Authority to
exercise the Council’s statutory powers (including any relevant powers
conferred by bylaw) over roads within the Board’s area in respect of:
(i)
Road
user behaviour at intersections;
(ii)
Controls
on stopping or overtaking
(iii)
Controls
on turning
(iv)
Pedestrian
safety,
(v)
Footpath
maintenance and improvements.
(vi)
Accident
investigation studies, lighting and other safety works
10. For the
avoidance of doubt, nothing in this delegation authorises a Community Board to
deal with a matter, in the exercise of delegated authority, in a manner which
is conflict with any policy or decision of the Council or any standing
committee of the Council in relation to the same matter.
HASTINGS DISTRICT COUNCIL
Hastings District Rural Community
Board MEETING
Monday, 11 September 2017
|
VENUE:
|
Landmarks Room
Ground Floor
Civic Administration Building
Lyndon Road East
Hastings
|
|
TIME:
|
2.00pm
|
|
A G E N D A
|
1. Apologies
At the close of the agenda no apologies
had been received.
At the close of the agenda no
requests for leave of absence had been received.
2. Conflict
of Interest
Members need to be vigilant to
stand aside from decision-making when a conflict arises between their role as a
Member of the Council and any private or other external interest they might
have. This note is provided as a reminder to Members to scan the agenda
and assess their own private interests and identify where they may have a
pecuniary or other conflict of interest, or where there may be perceptions of
conflict of interest.
If a Member feels they do
have a conflict of interest, they should publicly declare that at the start of
the relevant item of business and withdraw from participating in the
meeting. If a Member thinks they may have a conflict of interest,
they can seek advice from the Chief Executive or Executive Advisor/Manager:
Office of the Chief Executive (preferably before the meeting).
It is noted that while Members can
seek advice and discuss these matters, the final decision as to whether a
conflict exists rests with the member.
3. Confirmation
of Minutes
Minutes of the
Hastings District Rural Community Board held Monday 29 May 2017.
(Previously circulated)
4. Section 10A
Annual Report Dog Control 5
5. Ocean Beach
Road/Waimarama Road Intersection Improvements 13
6. Rural
Transportation Programme Update 11 September 2017 21
7. Funding Vista
Bridge Slip Repair Local Share 25
8. VDAM Rule Impact
Assessment 29
9. iWay Strategy
Update 35
10. Draft Financial result for the
year ended 30 June 2017 for Rating Area 2 47
11. Additional
Business Items
12. Extraordinary
Business Items
13. Recommendation
to Exclude the Public from Item 14 53
14. Public Works Act - Former
Clark's Quarry, Glengarry Road
REPORT TO: Hastings
District Rural Community Board
MEETING DATE: Monday 11
September 2017
FROM: Community Safety Manager
John
Payne
SUBJECT: Section
10A Annual Report Dog Control
1.0 SUMMARY
1.1 The purpose of this report is to update the
Committee on the dog control statistics for the annual Dog Report for the year 1 July 2016 to 30 June 2017.
1.2 Section
10A of the Dog Control Act 1996 requires Council adopt and publish an annual
report on the Administration of Council’s Dog Control Policy and
Practises.
1.3 Council
is required to give effect to the purpose of local government as prescribed by
Section 10 of the Local Government Act 2002. That purpose is to meet the
current and future needs of communities for good quality local infrastructure,
local public services, and performance of regulatory functions in a way that is
most cost–effective for households and businesses. Good quality means
infrastructure, services and performance that are efficient and effective and
appropriate to present and anticipated future circumstances.
1.4 This
report is information only.
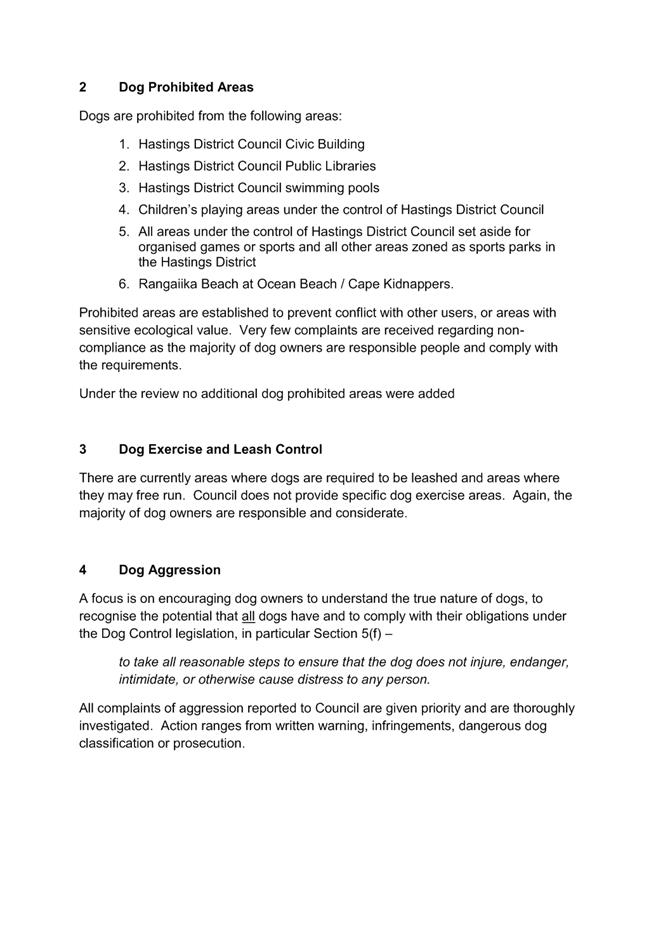
2.0 BACKGROUND
2.1 Section
10A of the Dog Control Act 1996 requires Territorial Authorities to publically
report each financial year on the administration of their dog control policy
and practise.
2.2 The
report must include information relating to:
· The number of registered dogs
· The number of probationary and disqualified owners
· The number of dogs classified dangerous or menacing
· The number of infringement notices issued
· The number of dog related complaints received and the nature of
those complaints
2.3 The
report is attached as Attachment 1.
2.4 Council
must give public notice of the report by means of a notice published in the
daily newspaper circulating in the district and by any other means considered
desirable.
2.5 Council
must, within one month of adopting the report, send a copy to the Secretary for
Local Government.
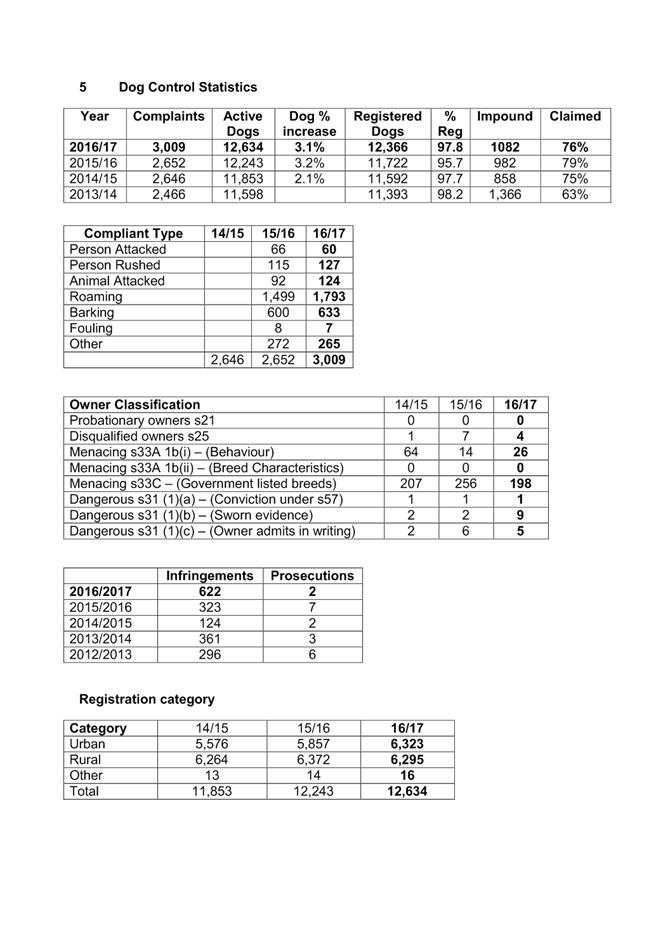
3.0 CURRENT
SITUATION
3.1 As at
30 May 2017 there were 12,366 dogs registered in Hastings district with
registration compliance reaching 97.9 percent.
3.2 There
are 15 dogs classified as dangerous and 224 classified as menacing.
3.3 There
has been a decrease in reported dog bites despite a 3.1 percent increase in dog
population.
4.0 SIGNIFICANCE
AND ENGAGEMENT
4.1 This
report is not significant in terms of Council’s Significance Policy but
it is a requirement of the Dog Control Act 1996. Council is required to
give public notice of the report advising where it can be viewed. After
adoption by Council the report will be posted on Council’s website.
4.2 Council
must, within 1 month of adopting the report send a copy of it to the Secretary
for Local Government.
|
5.0 RECOMMENDATIONS AND
REASONS
A) That
the report of the Community Safety Manager titled “Section
10A Annual Report Dog Control” dated 11/09/2017
be received.
With the reasons for this decision
being that the objective of the decision will contribute to meeting the
current and future needs of communities for performance of regulatory
functions in a way that is most cost-effective for households and business
by:
Ensuring Council meets its
requirements to publically report each financial year on the administration
of its dog control policy and practices as required by the Dog Control Act
1996.
|
Attachments:
|
1
|
10A Report
|
REG-1-14-17-7
|
|
REPORT TO: Hastings
District Rural Community Board
MEETING DATE: Monday 11
September 2017
FROM: Acting Traffic Engineer
Kathryn
O'Reilly
SUBJECT: Ocean
Beach Road/Waimarama Road Intersection Improvements
1.0 SUMMARY
1.1 The
purpose of this report is to obtain a decision from the Committee on the way
forward with safety improvements at the intersection of Ocean Beach Road and
Waimarama Road.
1.2 This
request arises from the Boards desire to receive an options report for the
intersection of Ocean Beach Road and Waimarama Road for possible safety
improvements.
1.3 The Council is required to give effect to the purpose of local
government as prescribed by Section 10 of the Local Government Act 2002. That
purpose is to meet the current and future needs of communities for good quality
local infrastructure, local public services, and performance of regulatory
functions in a way that is most cost–effective for households and
businesses. Good quality means infrastructure, services and performance that
are efficient and effective and appropriate to present and anticipated future
circumstances.
1.4 The
objective of this decision relevant to the purpose of Local Government is to provide good quality infrastructure that is safe, efficient and
effective in meeting the needs of present and anticipated future circumstances.
1.5 This
report concludes by recommending that the current layout is generally retained
with improvements being made to the visibility, signage & road markings, and minor adjustments to the Ocean Beach Road approach lane.
2.0 BACKGROUND
2.1 Following
an LTP submission to Council to improve the intersection of Ocean Beach Road
and Waimarama Road it was requested that an assessment of options be undertaken
to ascertain the possibilities to enhance safety at the intersection
2.2 The
submitter was concerned with the lack of visibility when exiting Ocean Beach
Road towards Havelock North in a motorhome/ute/truck.
2.3 The
submitter was also concerned that they were undertaking an illegal manoeuvre by
negotiating the intersection utilising the slip lane heading towards Waimarama
and turning right towards Havelock North.
3.0 CURRENT
SITUATION
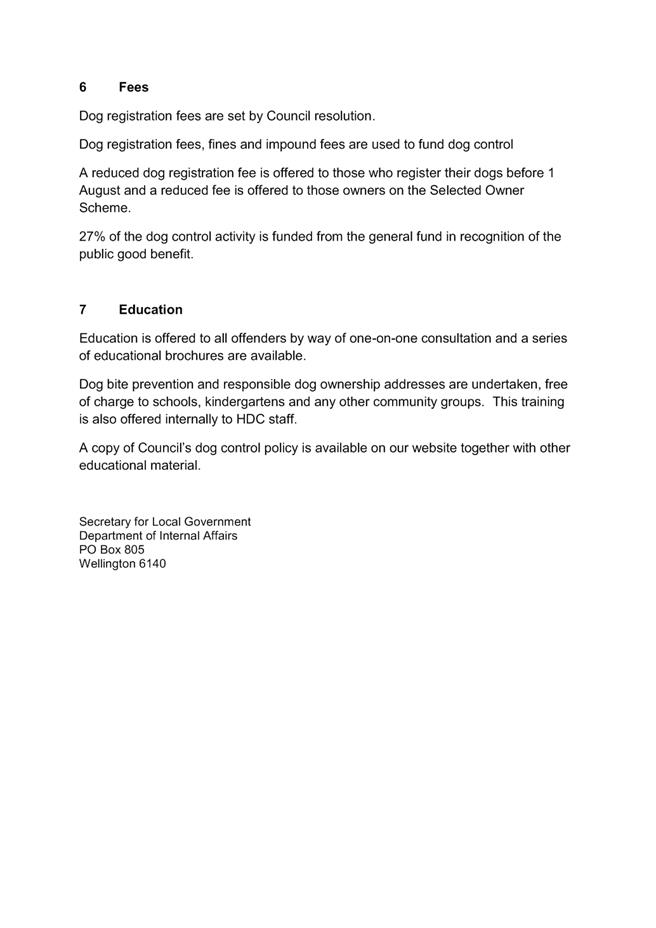
3.1 The
intersection currently resides on the outside of a ‘broken back’ or
compound curve which has two radii, one of 100m and one of 60m. The average
superelevation on the 100m radius section of the curve is 3.2% raising to 8.2%
on the 60m radius section. Based on the curve geometry (radii and
superelevation) the curve is correctly signposted at 45km/h. Ocean Beach Road
forms a ‘Y’ arrangement at the intersection with two way access on
both legs as seen in Photo 1 below.
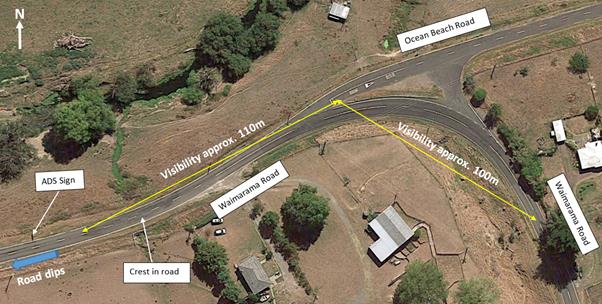
Photo 1: Aerial view of the intersection
3.2 For
vehicles approaching the intersection from Havelock North there is a map style
Advanced Directional Sign (ADS) located approximately 130m in advance of the
intersection. There is also a PW-18/PW-25 ‘45km/h’ curve warning
sign (with intersection stub) located approximately 70m in advance of the
curve. The curve warning sign is located closer to the intersection than MOTSAM
specifies, however the map ADS supplements this and is in the correct position.
3.3 For
vehicles approaching the intersection from Waimarama there is just a
PW-18/PW-25 ‘45km/h’ curve warning sign (with intersection stub).
This is approximately in the correct location, although could be brought back
10 or 20m out of the shadow of the trees. The right turn from Waimarama Road to
Ocean Beach Road is not a key movement and hence this approach does not have an
ADS.
3.4 For
vehicles wishing to exit Ocean Beach Road towards Havelock North there is a
‘Give Way’ control. Visibility from this ‘Give Way’
control west is currently restricted to between 110m and 250m by the vertical
geometry of the road, topography in the neighbouring property, power poles, the
fence and tall grass (refer photo 2 overleaf). This restriction results in
vehicles being hidden from view, to vehicles wanting to exit Ocean Beach Road,
for approximately 6 seconds. NB: the Safe Intersection Stopping Distance (SISD)
for a 100km/h approach vehicle (Reaction Time 2sec) is 248m.
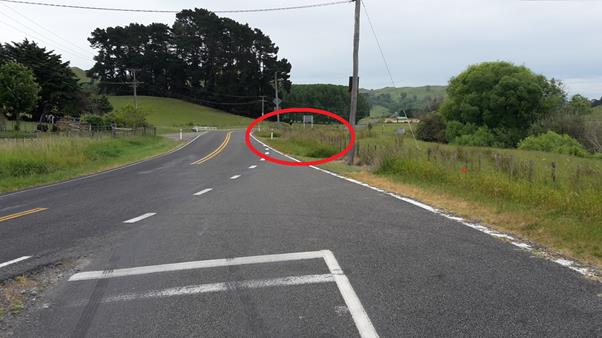
Photo 2: Visibility towards Havelock North
3.5 The
visibility towards Waimarama is approximately 100m, although vehicle speeds at
this point are slower and hence there is more time to judge a safe gap.
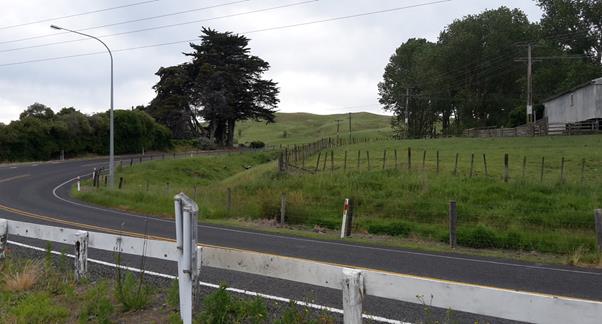
Photo 3: Visibility towards Waimarama
3.6 The
other leg of the intersection is used by far fewer vehicles heading to/from
Waimarama. Visibility to a vehicle turning right in is also limited and does
pose a safety risk albeit it lower.
4.0 CRASH
HISTORY
4.1 In
the most recent five years from 2012 to 2016 there has been one crash that has
occurred within 250m radius of the intersection. This crash occurred in
November 2016 and involved serious injuries to two occupants.
4.2 This
serious injury crash resulted from a tourist exiting Ocean Beach Road, and,
allegedly blinded by the sun, travelled on the wrong side of the road colliding
with an eastbound vehicle on the curve approximately 100m west of the
intersection.
4.3 This
single crash within the last five year raises the collective risk of the
intersection to Low-Medium. Taking in consideration the traffic flows the
intersection is performing as expected in relation to similar
intersections.
4.4 Looking
to the earlier five year period, between 2007 and 2011, there were five crashes
recorded within a 250m radius. Only one resulted in minor injuries with the
rest being classified as non-injury crashes.
4.5 The
crashes between 2007 and 2011 were:
4.5.1 A car lost control on the curve
travelling eastbound and hit a fence and tree (2008) – non injury
4.5.2 A car lost control 150m east of
the intersection on Ocean Beach Road (2009) – non injury
4.5.3 A car travelling from Ocean
Beach was hit in the rear by a car which was following too closely when
navigating the intersection (2009) – non injury
4.5.4 A car travelling westbound on
Waimarama Road hit another car head on. The at fault driver was an
overseas driver who had failed to drive on the correct side of the road (2010)
– minor
4.5.5 A car lost control travelling
eastbound and hit a fence and tree in the wet (2010) – non injury
4.6 In
summary the intersection has generally been performing well from a safety point
of view despite the deficiencies that exist.
4.7 In
saying this, it was observed that both injury crashes within the last 10 years
involved tourists exiting Ocean Beach Road and travelling in the wrong lane
resulting in a head-on crash. There are often many factors involved in any
crash, however, Photo 4 overleaf does show that the westbound approach lane on
Ocean Beach Road appears to line drivers up with the opposing lane on Waimarama
Road. For those unfamiliar with New Zealand driving conditions this arrangement
could confuse drivers, particularly if there are other factors involved, such
as sun-strike.
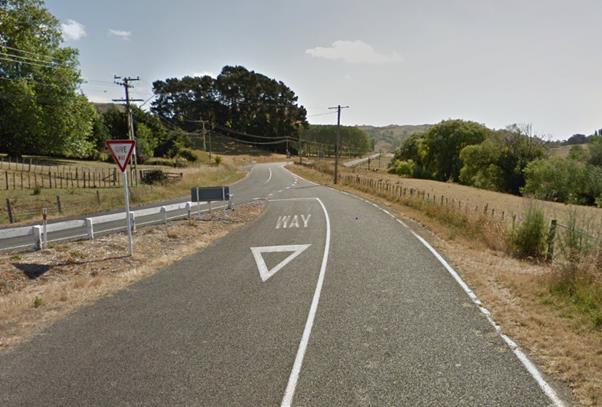
Photo 4: View on approach to Waimarama Road
from Ocean Beach Road
5.0 OPTIONS
5.1 The
options/safety improvement measures considered include:
Option
1 - Do Nothing
Option
2 - Low cost visibility improvements to the west
Option
3 - Signage and road marking improvements
Option
4 - Minor adjustment to the Ocean Beach Road approach lane
Option
5 - Install RIAWS (Rural Intersection Activated Warnings Signs) or electronic
curve warning signage
Option
6 - Improve vertical curves west of the intersection (for visibility)
Option
7 - Intersection reconstruction (Teeing up Ocean Beach Road, but excluding
right turn bay)
6.0 SIGNIFICANCE
AND ENGAGEMENT
6.1 The
matters in this report are deemed ‘not of significance’ in terms of
Council’s Significance and Engagement Policy. Some engagement will be
required with a local land owner for the preferred option(s).
7.0 OPTIONS
& ASSESSMENT OF OPTIONS
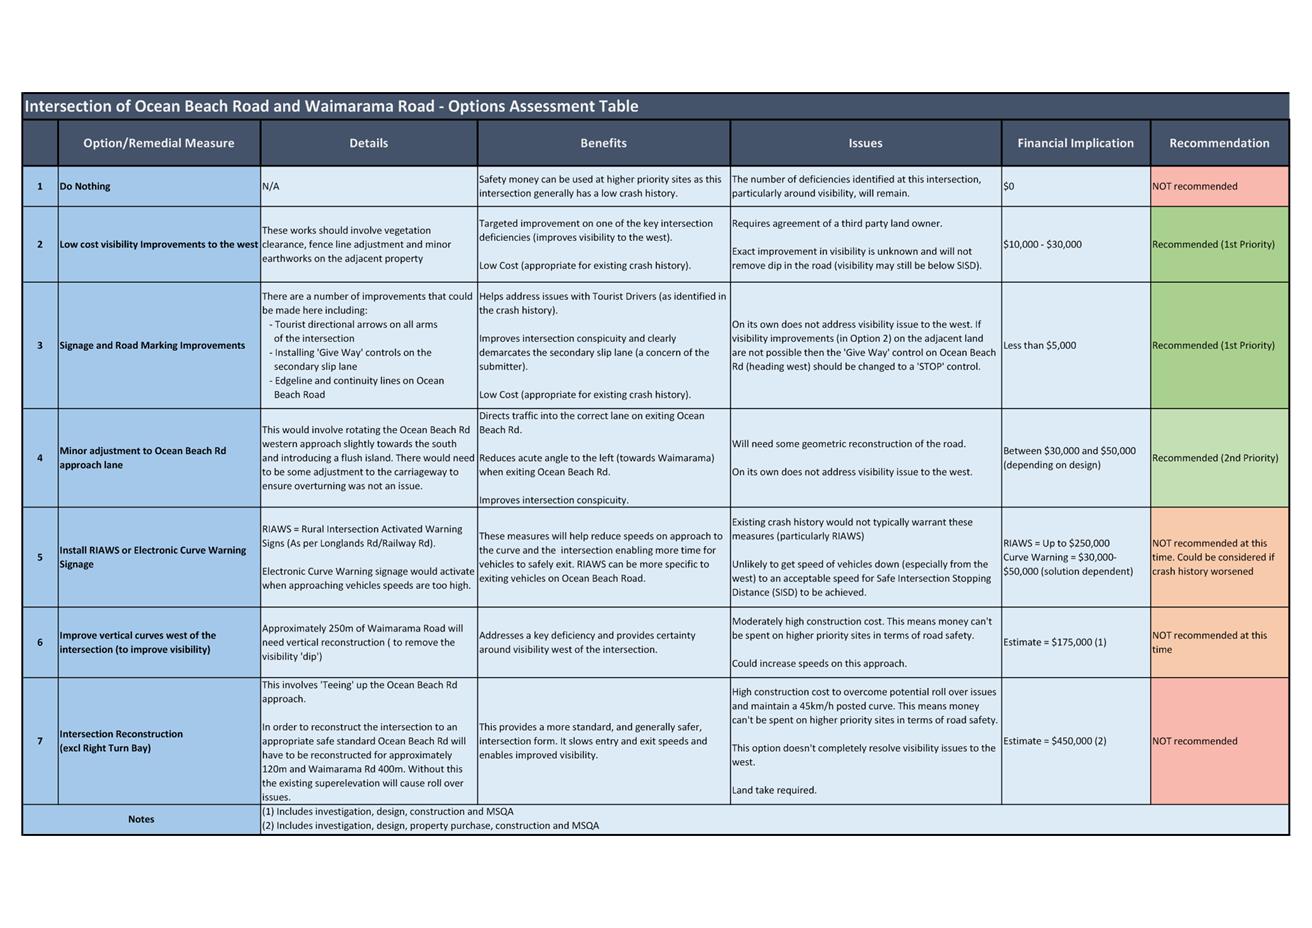
7.1 An
options assessment table has been developed (refer attachment) which contains
details of the potential safety improvement measures along with benefits,
issues, financial implications and recommendations.
8.0 PREFERRED
OPTION/S AND REASONS
8.1 The
assessment recommends proceeding with Options 2, 3 and 4 as they are
targeted to the deficiencies, improve intersection conspicuity and are of an
appropriate scale to the historical safety record. These option include:
· Low cost visibility improvements to the west – This involves vegetation clearance, fence line adjustment
and minor earthworks on the adjacent property (there is a need for engagement
and agreement with a third party land owner).
· Signage and road marking improvements – This involves tourist lane direction arrows, ‘Give
Way’ controls on the secondary slip lane, edge and continuity lines on
Ocean Beach Rad and a STOP control on Ocean Beach Rd (for westbound traffic)
should visibility improvements in 1 above not be possible.
· Minor adjustments to the Ocean Beach Road approach lane - This is to better direct vehicles (heading west) on the Ocean
Beach Rd approach into the correct lane on Waimarama Road.
8.2 The
assessment did NOT recommend proceeding with the installation of a RIAWS system
or electronic curve warning signage, or adjustment to the vertical curves to
the west at this time. If the crash record worsens then these measures could be
considered.
8.3 The
assessment did NOT recommend proceeding with an intersection reconstruction
(Teeing up Ocean Beach Road) as this was expensive, out of proportion to the
issues and did not fully address the visibility concerns
|
9.0 SUMMARY
OF RECOMMENDATIONS AND REASONS
A) That
the report of the Acting Traffic Engineer titled “Ocean
Beach Road/Waimarama Road Intersection Improvements” dated 11
September 2017 be received.
B) That
low cost visibility improvements, road marking & signage improvements and
minor adjustments to the Ocean Beach Road approach be implemented as part of
the minor improvements programme in the 2017/18 financial year.
With the
reasons for this decision being that the recommended improvements are
targeted and in context to the historical safety record of the intersection
and the road safety needs of other parts of the network. The improvements
will provide good quality infrastructure that is safe, efficient and
effective in meeting the needs of present and anticipated future
circumstances.
|
Attachments:
|
1
|
Ocean Beach Road/Waimarama Road Intersections
Improvements Report and Options Table
|
PRJ15-51-0143
|
|
Ocean Beach Road/Waimarama Road
Intersections Improvements Report and Options Table
|
Attachment 1
|
REPORT TO: Hastings
District Rural Community Board
MEETING DATE: Monday 11
September 2017
FROM: Transportation Operations Manager
Adam
Jackson
SUBJECT: Rural
Transportation Programme Update 11 September 2017
1.0 SUMMARY
1.1 The
purpose of this report is to update The Rural Community Board with the Rural
Transportation Programmed Project Status and Activities Report.
1.2 This
issue arises from the Board’s desire to receive regular updates on
progress with the works programme and other activities.
1.3 The
Council is required to give effect to the purpose of local government as
prescribed by Section 10 of the Local Government Act 2002. That purpose is to
meet the current and future needs of communities for good quality local
infrastructure, local public services, and performance of regulatory functions
in a way that is most cost–effective for households and businesses. Good
quality means infrastructure, services and performance that are efficient and
effective and appropriate to present and anticipated future circumstances.
1.4 This
report concludes by recommending that the report be received.
2.0 2017/18
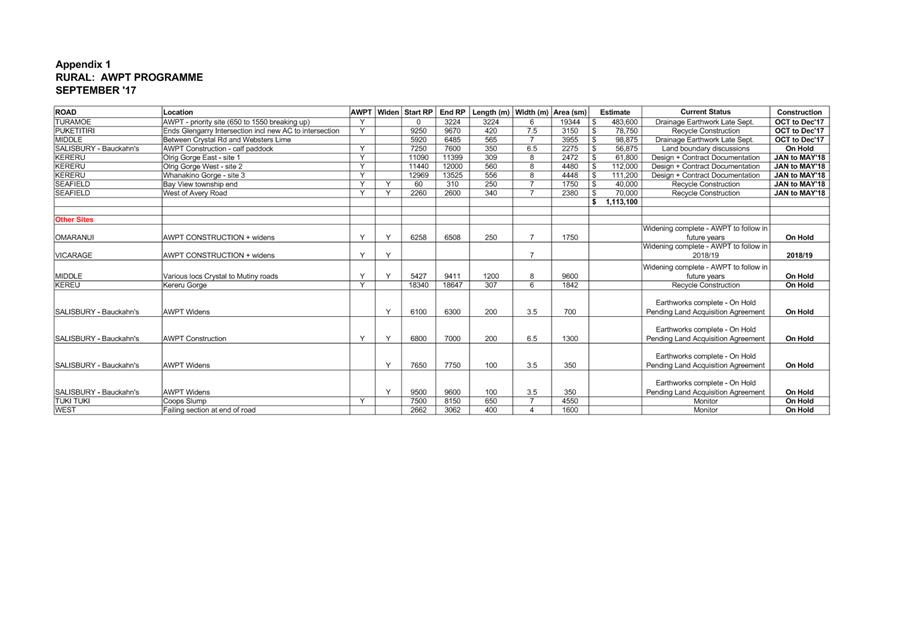
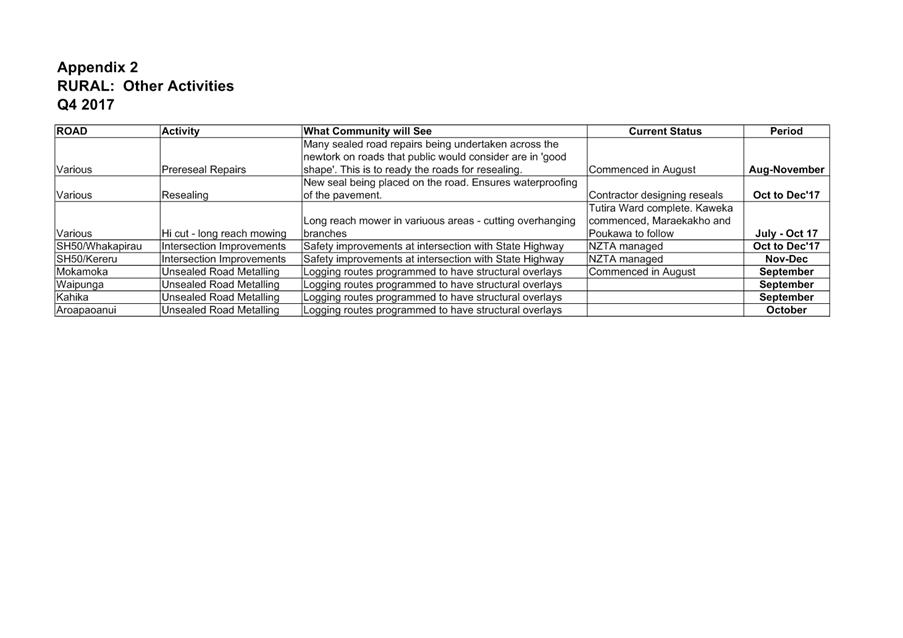
RURAL TRANSPORTATION PROGRAMME PROJECT STATUS and ACTIVITIES REPORT
2.1 2017/18
Rural AWPT Programme current status is attached – Attachment 1.
|
3.0 RECOMMENDATIONS
AND REASONS
A) That
the report of the Transportation Operations Manager titled “Rural
Transportation Programme Update 11 September 2017” dated 11/09/2017
be received.
|
Attachments:
|
1
|
Rural AWPT Programme September 17
|
CG-14-26-00026
|
|
|
Rural AWPT Programme September 17
|
Attachment 1
|
REPORT TO: Hastings
District Rural Community Board
MEETING DATE: Monday 11
September 2017
FROM: Bridge Engineer
Anu
Ileperuma
SUBJECT: Funding
Vista Bridge Slip Repair Local Share
1.0 SUMMARY
1.1 The purpose of this report is to obtain a decision from the Hastings
District Rural Community Board on funding the local share required to repair
the slip located at Vista Bridge.
1.2 This
issue arises from the need to protect structural integrity of the Vista Bridge.
1.3 The
Council is required to give effect to the purpose of local government as
prescribed by Section 10 of the Local Government Act 2002. That purpose is to meet
the current and future needs of communities for good quality local
infrastructure, local public services, and performance of regulatory functions
in a way that is most cost–effective for households and businesses. Good
quality means infrastructure, services and performance that are efficient and
effective and appropriate to present and anticipated future circumstances.
1.4 The
objective of this decision relevant to the purpose of Local Government are infrastructure
development to support economic growth and accessible transport options.
1.5 This
report concludes by recommending that the Rural Community Board approves the local
share of $216,200 from the Rural Flood Emergency Event Reserve for the Vista
Bridge slip repair.
2.0 BACKGROUND
2.1 Vista Bridge is a single lane bridge spanning 68 metres across a 20
metre deep gorge situated on Waitara Road north of Napier and connects to State
Highway 5.
2.2 The
bridge was subjected to routine inspections in two yearly intervals. There were
some instability noted in the earlier inspections but these were insignificant
surface failures.
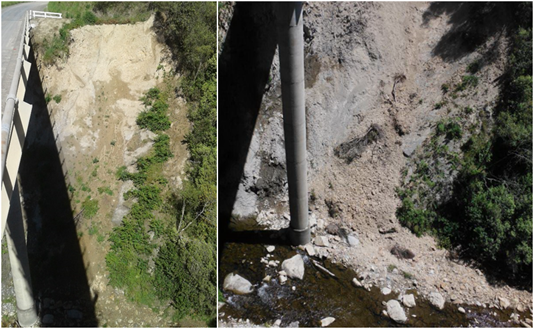
2.3 The
slip pictured below was identified during routine inspections carried out in
late November 2015. Since the discovery the slip has been monitored for further
movements and shows that slip is continuing to spread slowly.
2.4 MWH
was appointed to undertake an assessment of the slip failure and identify
associated risks. The consultants identified that predominant failure mechanism
is a combination of wedge, planer and toppling failure within very weak
mudstone. They have stated that the risk of the slip undermining the western
abutment is very high.
2.5 There
were several options proposed to repair the slip area. The urgent minor
improvements needed to storm water drainage was completed until a permanent
solution was formed.
2.6 Out
of the possible options, active slope stabilisation and supplementary bridge
pile were considered further.
2.7 In a
report presented to Rural Community Board on the 27th February 2017,
the supplementary bridge pile option was recommended with a cost estimate of
$790,000.
2.8 The
work was recommended to be phased over two financial years and be absorbed to
current budget provisions provided in the maintenance budget as the additional
funding application to New Zealand Transport Agency (NZTA) was declined.
2.9 Maintenance
programme was to be prioritised to accommodate the budget requirements of the
repair.
3.0 CURRENT
SITUATION
3.1 The
supplementary pile option encountered problems due to issues with transferring
the loads to the new piles from the existing central pile. Therefore, the
active slope stabilisation option was chosen. This option comprise of
installing integrated rock bolts and a mesh system to stabilise the slip face
from regressing further.
3.2 The
preferred solution is estimated to cost $470,000. The project is being
progressed to detail design.
3.3 The
intention is to finish the repair by end of 2017/18 financial year.
3.4 Other
funding options such as claiming funding through Council’s bridge
insurance for the repair was pursued but was unsuccessful.
3.5 Following
meetings with NZTA, Council has applied for additional funding assistance at a
rate of 54% under flood damage and is awaiting approval. This funding is highly
likely to be approved.
3.6 This
reduces the risk to the rest of the bridge network as the maintenance budgets
are no longer constrained.
3.7 Local
share of $216,200 will need to be sourced to complete the repair in this
financial year.
4.0 SIGNIFICANCE
AND ENGAGEMENT
4.1 Bridge
structures are categorised as part of infrastructural strategic assets Council
owns. However only the decisions that affect the asset group as whole, is
considered significant. Therefore, the decision about Vista Bridge alone does
not trigger the Significance and Engagement Policy. However, affected parties such
as PanPac will be consulted before construction/repair work will be undertaken.
5.0 FINANCIAL
IMPLICATIONS
5.1 Amount
of local share required for the slip repair is $216,200.
5.2 The
local share is recommended to be funded through Rural Flood Emergency Event
Reserve as the cause of the slip is storm water damage and the fund was set up
to meet local share of such repairs.
5.3 The
local share required can be funded from the Rural Flood Emergency Event Reserve
which has a balance of $1,699,552 as at 17 August 2017.
|
6.0 RECOMMENDATIONS
AND REASONS
A) That
the report of the Bridge Engineer titled “Funding Vista
Bridge Slip Repair Local Share” dated 11/09/2017
be received.
B) That
the Rural Community Board approves the local share of $216,200 from the Rural
Flood Emergency Event Reserve for the Vista Bridge slip repair.
With the reasons for this decision
being that the objective of the decision will contribute to meeting the
current and future needs of communities for good quality local infrastructure
by:
i) Maintaining good quality local infrastructure in a way that is most
cost–effective for households and businesses.
|
Attachments:
There are no
attachments for this report.
REPORT TO: Hastings
District Rural Community Board
MEETING DATE: Monday 11
September 2017
FROM: Bridge Engineer
Anu
Ileperuma
SUBJECT: VDAM
Rule Impact Assessment
1.0 SUMMARY
1.1 The
purpose of this report is to inform the Rural Community Board regarding the
Vehicle Dimension and Mass (VDAM) Rule imposed bridge restriction impacts on
the district and to seek guidance from the Board on the preferred
implementation strategy.
1.2 This
proposal arises from the recent regulatory change in the VDAM rule which
impacts the management of bridge structures owned by Hastings District Council.
1.3 The
Council is required to give effect to the purpose of local government as
prescribed by Section 10 of the Local Government Act 2002. That purpose is to
meet the current and future needs of communities for good quality local
infrastructure, local public services, and performance of regulatory functions
in a way that is most cost–effective for households and businesses. Good
quality means infrastructure, services and performance that are efficient and
effective and appropriate to present and anticipated future circumstances.
1.4 The
objective of this decision relevant to the purpose of Local Government is infrastructure
development to support economic growth and providing accessible transport
options within the district.
1.5 This
report concludes by recommending that the Rural Community Board adopts the
proposed bridge implementation strategy with or without amendments following
consultation with Council subjected to Long Term Planning process for
2018/2028.
2.0 BACKGROUND
2.1 Vehicle
Dimension and Mass (VDAM) rule sets out the requirements for dimension and mass
limits to enable vehicles to operate safely on New Zealand’s roads.
2.2 The
intention was to set a reasonable balance between risks heavy vehicles present
to public safety and efficient operation of heavy vehicle fleet within
constraints imposed by the network.
2.3 The
revised rule with significant changes to general weight (laden weight of a
vehicle) came into effect 1st February 2017.
2.4 As
previously reported to the Board, all the bridges on the network were screened
to assess whether they had the capacity to meet the new general weight limits
prescribed by VDAM rule 2016.
2.5 The
changes to VDAM rule meant that current approach to management of bridges
needed to be changed to align with the rule.
2.6 Hastings
District Council had adopted a “balanced approach” to bridge
management which categorised the bridge stock to either strengthening, posting
(weight restriction) or managed categories. While strengthening and posting are
self-explanatory, managed structures were defined as the bridges that are under
general weight capacity, however were put through an inspection regime to
manage the risk instead of imposing restrictions.
2.7 Under
the new rule, this approach cannot be utilised as it demands for the bridges
under capacity to be posted. This results in increased number of restrictions
being placed on the network.
3.0 CURRENT
SITUATION
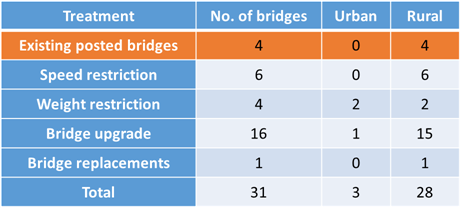
3.1 The
bridge assessments for the network were carried out and it produced the
following results.
3.2
3.3 A
high level prioritisation of the bridge results were put together using
existing data such as heavy vehicle count on the road, land use and route
priority (lifeline).
3.4 This
information was presented to a group of targeted stakeholders at a workshop
held on 3 August 2017 to seek their comments with regards to business impact
and to confirm the order of priority for proposed bridge upgrades.
3.5 At
the workshop the group was divided to three categories of forestry,
stock/farming and transport depended on the industry the individual
represented.
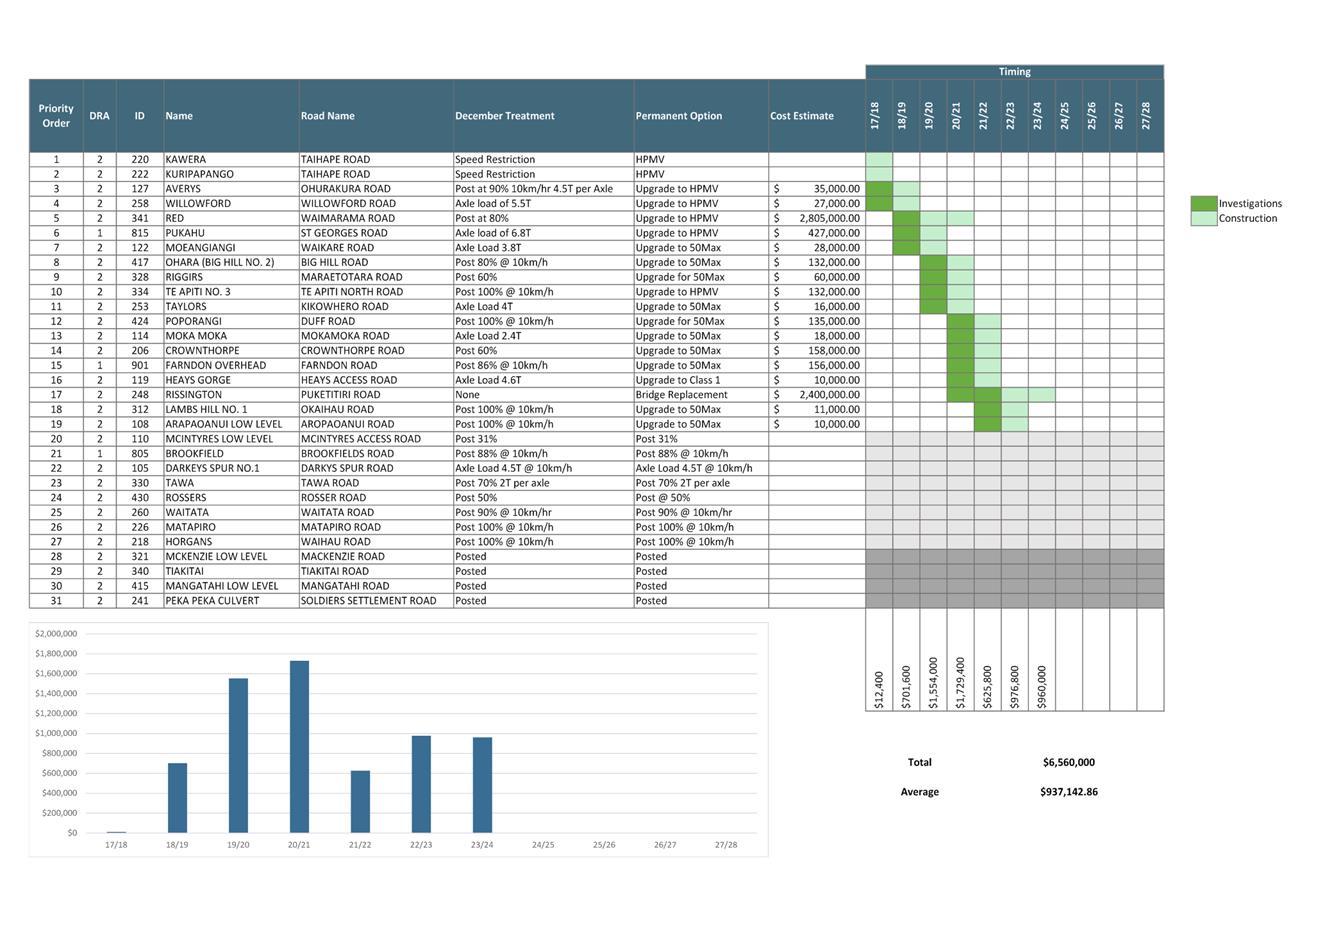
3.6 The
results were then gathered and collated into a proposed implementation plan to
reflect the priorities confirmed by the group.
3.7 The
proposed plan extends over seven years and is attached with this report.
3.8 Another
consultation round was held on 1 September 2017 to confirm the way forward with
the targeted stakeholders.
4.0 OPTIONS
4.1 There
are two options proposed, which are:
4.2 Option
1: Do nothing (place restrictions)
4.3 Option
2: Council adopts proposed plan with or without amendments subject to Long Term
Plan (LTP) 2018/2028 process.
5.0 SIGNIFICANCE
AND ENGAGEMENT
5.1 The
implementation of the proposed plan does trigger significance and engagement
policy as the expenditure proposed is significant as well as the number of
people affected.
5.2 Due
to the significance of the expenditure and the approach, the proposed
implementation plan will be subjected to LTP 2018/2028 process.
5.3 A
targeted stakeholder workshop was held and the implementation plan was amended
accordingly. Another consultation meeting was held to confirm the implementation
plan. Any feedback and amendment to the current plan will be tabled at the
coming Rural Community Board meeting.
5.4 Directly
affected properties are to be consulted via Rural Community Board newsletters
prior to finalising implementation plan.
5.5 Regional
Land Transport Committee to be consulted alongside neighbouring councils prior
to finalising implementation plan.
6.0 ASSESSMENT
OF OPTIONS (INCLUDING FINANCIAL IMPLICATIONS)
6.1 Implementation
of Option 1 is as below:
6.1.1 Advantages:
· Minimal financial impact on the district
6.1.2 Disadvantages:
· Accessibility of general weight vehicles reduces over the roading
network
· Increased restrictions placed on the network, leading to inefficient
travel for industries such as forestry, farming, stock and transporter
· Increased transport costs to be primary industries as the operators
will impose higher transportation costs due to restrictions
6.2 Implementation
of Option 2 is as below:
6.2.1 Advantages:
· Improved level of service for the travel of industries mentioned
above
· Reduced restrictions on the roading network, leading to increased
accessibility and resilience of the network
· Supporting economic growth of the region through reduced travel
costs to the industry operators and producers
6.2.2 Disadvantages:
· Significant financial impact to undertake strengthening work
required on the under capacity bridges
6.2.3 The draft budget will be subjected to LTP process
to get approval from the Council and NZTA
6.2.4 A business case have been prepared to NZTA and if
approved a Funding Assistance Rate (FAR) of 54% is expected.
|
Cost
|
2018/19
|
2019/20
|
2020/21
|
2021/22
|
2022/23
|
2023/24
|
|
Expected
NZTA Share
|
$263,007
|
$866,484
|
$946,809
|
$337,932
|
$527,472
|
$518,400
|
|
Expected Local Share
|
$224,043
|
$738,116
|
$806,541
|
$287,868
|
$449,328
|
$441,600
|
|
Rating Area 2 Impact
|
$184,759
|
$580,980
|
$792,189
|
$230,460
|
$449,328
|
$441,600
|
6.2.5 This will have a local share impact of:
7.0 PREFERRED
OPTION/S AND REASONS
7.1 The
preferred option is option 2.
7.2 Even
though Option 2 will have a significant financial impact on the rate payers, it
provides many benefits to the community, supports economic growth and reduces
the restrictions placed on the roading network which builds a more resilient
network.
|
8.0 RECOMMENDATIONS
AND REASONS
A) That
the report of the Bridge Engineer titled “VDAM Rule
Impact Assessment” dated 11/09/2017 be received.
B) That following consultation and subject to Long Term Planning
process for 2018/2028 the Hastings District Rural Community Board adopts the
proposed bridge implementation strategy with or without amendments.
With the reasons for this decision
being that the objective of the decision will contribute to meeting the
current and future needs of communities for good quality local infrastructure
in a way that is most cost-effective for households and business by:
i) Reducing restrictions placed on the roading network
ii) Improving roading connections to support economic growth in the
region.
|
Attachments:
|
1
|
VDAM Implementation Plan 28/08/2017
|
TR-2-3-17-5
|
|
|
VDAM Implementation Plan 28/08/2017
|
Attachment 1
|
REPORT TO: Hastings
District Rural Community Board
MEETING DATE: Monday 11
September 2017
FROM: Strategic Transportation Engineer
Nilesh
Redekar
SUBJECT: iWay
Strategy Update
1.0 SUMMARY
1.1 The
purpose of this report is to update the Board about the proposed iWay Strategy
and also on the recommendation of the Strategy Implementation Plan.
1.2 At the Works and Services Committee meeting on 22 August 2017 it was
resolved to accept the proposed strategy and deliver all identified projects
over the next 3 years and the remaining projects over the following 12 years as part of the Long Term Plan 2018-28 process.
1.3 This
proposal arises from the desired to have a clear direction on iWay following
the successful delivery of Model Community and Urban Cycleway Programme and to
move towards the goal of a safe, attractive and connected cycle network in a
‘complete streets’ setting.
1.4 The
Council is required to give effect to the purpose of local government as
prescribed by Section 10 of the Local Government Act 2002. That purpose is to
meet the current and future needs of communities for good quality local
infrastructure, local public services, and performance of regulatory functions
in a way that is most cost–effective for households and businesses. Good
quality means infrastructure, services and performance that are efficient and
effective and appropriate to present and anticipated future circumstances.
1.5 The
objective of this decision relevant to the purpose of Local Government is to
provide good quality infrastructure that is safe, affordable, integrated,
accessible, efficient, and effective in meeting the needs of present and
anticipated future circumstances.
1.6 This
report concludes by recommending that the Hastings District Community Board
will adopt the proposed iWay Strategy for strategic direction and will consider
implementing Option 1 as part of the Long Term Plan 2018-28 process.
2.0 BACKGROUND
2.1 It is becoming increasingly
recognised in New Zealand and abroad that cycling benefits society in a number
of ways including lower traffic congestion (due to fewer motor vehicles on the
road network), improved health (including mortality and morbidity), reduced
vehicle operating costs and improved travel times (related to efficiency in
conditions of lower congestion) and reduced pollution (since active transport modes
involve no emissions).
2.2 To increase the proportion
of trips made by cycle it will be necessary to attract a larger proportion of
the general population to cycle. Studies show that a large proportion of
the population who do not currently cycle for transport are willing but wary of
doing so without physical protection from high-speed or high-volume motor
traffic. Therefore, it is necessary to provide connected routes with
provisions that are suitable to the surrounding traffic environment.
2.3 Almost a decade ago, the New
Zealand Transport Agency selected Hastings as one of two places (New Plymouth
was the other) for the Model Communities Programme: a focused investment in
cycling infrastructure, education and encouragement. This initial project
grew into iWay, and has been bolstered through additional investment from the
national Urban Cycleways Programme (UCP, 2015-2018). The iWay programme has
included:
· A
focus on developing four key arterial routes into the city centre, completing
routes and linking communities and modes;
· Complementary
on-road cycle improvements on key collector routes;
· Shared pathway
projects;
· Footpath renewal,
connectivity and lighting;
· A network of
information signs, bike stands and seats;
· The MoveIt education programme, including cyclist skills training,
Share the road and Be Safe Be Seen campaigns, promotional campaigns for
‘Walk and cycle to school’, ‘Walk and cycle to work’,
‘Walk and cycle to the shop’ and ‘Walk and cycle for
fun’, and other safety programmes
2.4 Figure
1 presents the key milestone in the planning and implementation of the walking
and cycling network –
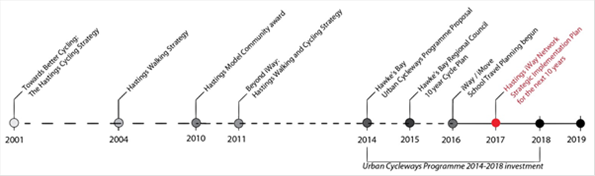
Figure 1 – Recent History of
the Hastings District Council iWay development
3.0 CURRENT
SITUATION
3.1 Figure
2 is an overview of the iWay network. Existing routes are denoted by solid
lines and proposed routes are dashed lines.
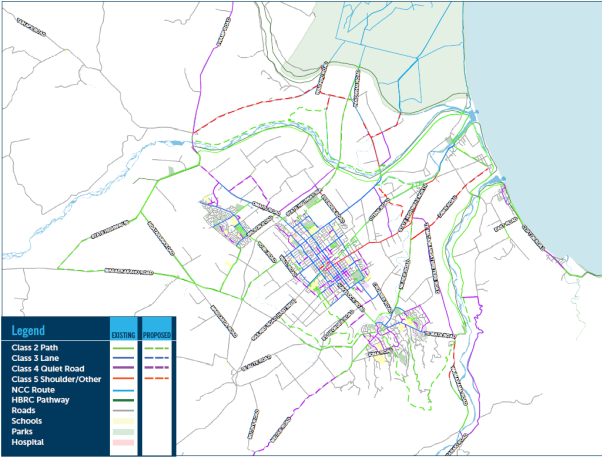
Figure 2 – Overview map of
iWay network
3.2 The
network consists of following types of cycle facilities –
· Shared Paths (i.e. Class 2) are shared by cyclists and pedestrians.
They are either sealed (e.g. concrete or asphalt) or unsealed (e.g. limestone
aggregate – and often referred to as a trail). May be along a road or
through a park or waterway reserve and are traversable by any type of cycle
(excludes mountain bike trails).
|
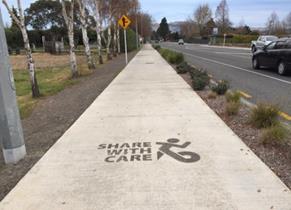
Concrete
shared path, Havelock Rd, Hastings
|
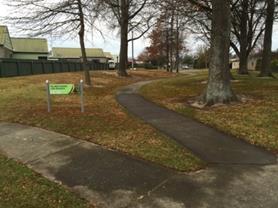
Palmer
Symons Link Reserve, Hastings
|
Figure 3 – Examples of Shared
Path on iWay network
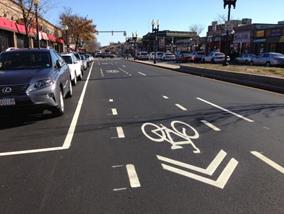
· Cycle lane (Class 3) on the carriageway is legally designated by a
painted cycle symbol; motorists may not park in or drive along (except to
turn). They are normally provided adjacent to the kerb or parking, or between
general traffic lanes on an intersection approach.
|
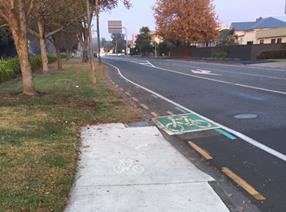
Shared
path transition to kerb-side cycle lane, Railway Road, Hastings
|
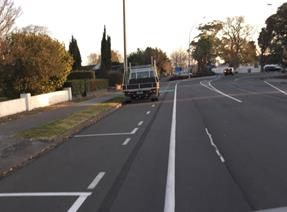
Car-side
cycle lane, Te Mata Rd, Havelock North
|
Figure 4 – Examples of Cycle
Lane on iWay network
· Neighbourhood greenway or quiet streets/roads (Class 4) have low
traffic volumes and speeds. They are always indicated by way finding signage
and may have traffic calming features and/or sharrows.
|
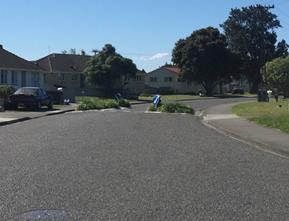
Quiet
street with 1-lane constriction point, Lowe St, Hastings
|
Quiet,
low volume and speed rural road, Gilbertson Road, Hastings
|
Figure 5 – Examples of
Neighbourhood Greenway or Quiet Streets/Roads on iWay network
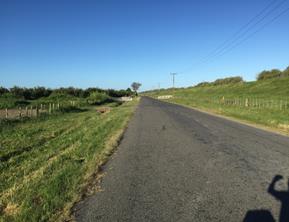
· Other (Class 5) including bus lanes (by default shared by cyclist),
wide shoulders (typically rural roads), or mixed traffic lanes with sharrows
(e.g. low speed shopping district main streets such as Heretaunga Street).
|
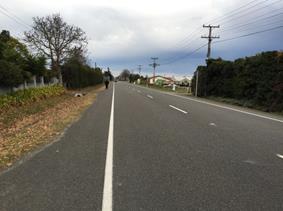
Wide
shoulders, St. George’s Rd, Hastings
|
Shared
lane on commercial street, Boston, Massachussetts
|
Figure 6 – Examples of Other
facilities on iWay network
3.3 Overall,
the iWay programme over last few years has achieved:
· Increase
in average annual daily cycling traffic (as counted at 25 short term and 9
permanent automatic count stations). In 2016, the average daily cycle
traffic at the nine permanent counters was over 650 and over 235,000 trips were
recorded.
· Active travel to school is increasing, as measured at a set of
primary, intermediate and high schools to be tracked over time (baseline
surveys and cycle/scooter stand counts have been taken at seven schools).
· Reported injury crashes involving people on bikes are
declining. Between 2008 and 2015, the five-year rolling average of
cyclist-reported injury crashes has decreased by about 4% each year.
· Nearly 90% of combined arterial and collector roads in Urban Area
and over 20% in Rural Area have provided cycle facilities however many urban
intersections still did not have any provision for cyclists.
3.4 Hastings
has already made great progress on the iWay network and been recognised as an
innovation leader for endeavours such as trialling ‘sharrow’
(shared lane) markings, applying green cycle lane delineation and the award-winning
MoveIt campaign. Even so, there is still much work to be done and it will
be necessary to challenge the current norms even further. Some of the key
examples include -
· St Aubyn Street currently has Class 3 cycle lanes, but as
intersections are the critical points for cycling safety and most of the
intersections along the route require further improvements.
· Lack of east-west cycle connectivity at south of the Hastings;
· There are still few Arterial and Collector Roads in urban areas that
has no cycle facility especially at intersections.
· Over 20 schools within the district do not have any adequate
cycle–walk facility;
· There are many gaps identified within iWay network over last few
years that raises concerns to beginner and advanced cyclists.
4.0 STRATEGY
UPDATE – the Vision
4.1 Moving
forward and to achieve the best outcome for the district, a simple and
realistic vision is developed (and is further explained in detail in Attachment
1)
“Hastings
District has a safe, attractive and connected cycle network in a
‘complete streets’ setting, that gives people of all ages and
abilities more mobility choices and a higher quality of life”.
4.2 The
full realisation of our vision will depend on the degree to which we take the
next steps over next ten years:
Adopting
a complete street approach, where streets are planned, designed, operated, and
maintained to provide safe mobility for all users, including cyclists,
pedestrians, buses, truck drivers, and motorists, appropriate to the network
function and context. Complete streets will support more liveable and
economically vibrant places;
Improving
the safety, comfort and quality of existing cycleways, especially at
intersections;
Developing
a family-friendly “neighbourhood greenway network” using local
streets with reduced motor traffic speeds/volumes, and crossing facilities
where they intersect with busier streets;
Completing
urban network gaps and major cross-city corridors;
Improving
connections to the Hawke’s Bay Trail Network (part of the New Zealand
Cycle Trails (NZCT), also known as the Great Rides) and between district urban
areas (Flaxmere, Clive, Whakatu, Haumoana, and Havelock North).
4.3 As
explained in Attachment 1, the principal policy drivers for iWay are
further illustrated in Figure 7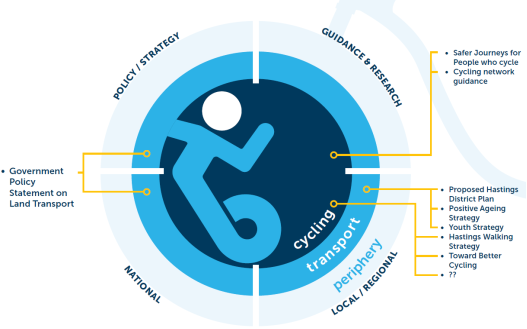
Figure 7 – Policy and
guidance forming the rationale for investing in iWay
4.4 As
part of the iWay Strategy a thorough analysis was carried out to identify
existing gaps (i.e. connectivity and missing facilities), inconsistency and
other deficiencies within iWay network projects. The analysis includes
fieldwork, review of previous planning efforts, consultation with the Active
Transport Group (ATG) and desktop gap analysis.
4.5 If
several different gaps exist along the length of a particular cycling route,
they are treated as one corridor project. The full list of project corridors
and area wide network programme are further prioritised as briefly explained in
Section 3.11 to 3.16 (and comprehensively explained in Attachment 1 –
Section 2.2).
4.6 As
well as the physical provision that make up the iWay network, a number of
programmes are proposed to encourage people for cycling and enable them to do
it appropriately through education. Following is list of education/encouraging
programme –
· Cycle Skills Training – Level 1 basic skills to primary school
and Level 2 on-road training to intermediate school;
· Scooter Safety Programme (based on NZ Transport Agency Guidelines)
tailored for Yr 4 students;
· MoveIt and School Travel Plans – is successfully implemented
to few schools within Hastings and is aimed to continue rolling across the
district.
· Be Safe Be Seen – working closely with community to raise
awareness about safe ride during winter;
· Sponsoring Events – providing encouragement to community to
explore iWay network;
· Monitoring
and Evaluation – extending the existing nine permanent auto counters
across the network to closely evaluate progress of iWay.
4.7 All
identified projects are prioritised using the ActiveTrans Priority Tool
(National Cooperative Highway Research Program, 2015) during the ten -year
period (2018-28). The analysis presented provides a transparent and flexible
tool for walking and cycling projects based on multi-year research and the
experience of the top jurisdictions in the World.
4.8 The
prioritisation can be easily updated as more information becomes
available. The criteria used are presented in Table 1.
Table 1:
Prioritisation criteria and scoring method summary
|
Factors (criteria)
|
Variables (sub-criteria)
|
Scoring method
|
|
Constraints
|
Cost
|
Order of magnitude, planning level cost estimate. Included to
ensure a value-for-money approach, but with a lower weighting to recognise
that factors that contribute to achieving the vision are more important.
|
|
Opportunities
|
Planned maintenance
|
Higher priority to iWay projects that can be coordinated with other
roading projects, to increase economies of scale and avoid
“double-passing” of roadworks.
|
|
Safety
|
Total cycle crashes
|
Based on reported crashes in the NZTA Crash Analysis System (CAS)
from Jan 2006- Apr 2017. Higher crashes indicate an increased priority[1].
Note that fatal and serious crashes are included in both datasets –
this is to elevate the priority of addressing sites with these crashes.
|
|
Fatal & serious injury cycle crashes
|
|
Existing conditions
|
Average daily traffic
|
A proxy for safety, to account for locations where cyclists may not
currently be present or where crashes have not yet occurred due to chance.
Safety is associated with the volume and speed of motor vehicles that are in
the road corridor; higher values indicate an increased priority for
treatment.
|
|
Posted speed
|
|
Demand
|
Total number of cyclists predicted
|
Based on census usually resident population data within defined
buffers around the corridor, using the NZTA Economic Evaluation Manual
Simplified Procedures 11 method. Adjustments have been made based on
judgement and existing volumes. The assumptions include existing census
mode share and network completion / facility quality.
|
|
Connectivity
|
Connected to existing iWay
|
Highest priority for projects that fill a gap in an existing
corridor. Medium priority for projects that extend a corridor or branch
off from an existing corridor. Lowest priority for projects not connected to
existing corridor.
|
|
Number of schools served
|
Higher priority for projects that involve
a greater number of schools on the corridor or within 100m of the route via
existing iWay facility or low volume local street.
|
4.9 The proposed iWay vision promotes safety, connectivity and usage by
people of all ages and abilities, therefore the factors for safety (both
observed through crash records and predicted through existing motor traffic
conditions), demand, and connectivity have been given the highest
weightings.
4.10 The variables relating to cost and opportunities for coordination
with other projects are considered important in terms of achieving a
value-for-money solution and public buy-in during the installation phase, but
are not the most critical aspects to achieving the vision, and have therefore
been giving medium weightings.
4.11 Stakeholder
input was considered as a variable (especially noting that a limited
consultation is carried out at this stage), but it was determined that the
information gained from the Active Transport Group workshops was more directed
at developing the project descriptions rather than prioritising between
projects, and would not give enough detail to be included in the
prioritisation.
4.12 Another
variable considered related to whether the project falls within the existing
road corridor, but at this stage of development, it was considered that the
information available was insufficient to accurately determine this.
4.13 Overall thirty projects are selected as part of the Strategy and
based on the prioritisation method, following top ten projects as shown in
Table 2 are identified. (The entire list of prioritisation is available in
Appendix 1, Section 2.2.3) that are to be led by HDC.
Table
2:
Corridor prioritisation results
|
Priority
|
ID
|
Location
|
Prioritization Score
|
|
1
|
4
|
St Aubyn St upgrade
|
343.3
|
|
2
|
2
|
Willowpark Rd
|
326.0
|
|
3
|
3
|
Southampton St upgrade
|
316.3
|
|
4
|
17
|
Pakowhai Rd Stage 4
|
231.6
|
|
5
|
16
|
Brookfields Rd (Completed)
|
215.8
|
|
6
|
19
|
Napier Road Stage 2
|
215.0
|
|
7
|
12
|
Te Aute Rd urban
|
207.5
|
|
8
|
13
|
Te Aute Rd rural
|
197.6
|
|
9
|
23
|
Southland Drain (Southern Link Path)
|
187.6
|
|
10
|
11
|
Portsmouth Rd
|
179.0
|
4.14 A
sensitivity analysis is also carried out to evaluate that a single factor does
not have dominance over the priority output and the ranking provided is robust
and is reliant on several factors. Interestingly all top three projects
remained same during all scenario and sensitivity testing.
4.15 The
economic evaluation carried out for all identified projects especially the
first ten prioritised projects are likely to achieve significant benefits that
will outweigh the associated implementation cost.
4.16 The
most identified projects fall under rating area 1 (DRA 1), except Waimarama
Road (Mad Mile Section), Middle Road and Whirinaki Road Improvement projects.
4.17 All
three projects in rating area 2 (DRA 2) are identified as a regional priority
considering their significance in NZ Cycle Trail and are currently proposed to
be delivered during first three years (2018-21), although the
prioritisation indicates that all three projects have a priority ranking above
10. Also there are no funds allocated in the LTP (or Annual Plan) for any
projects in rating area 2 (DRA 2).
4.18 Waimarama
Road ‘Mad Mile’ Improvements – This work is led by
Hawke’s Bay Regional Council (HBRC) and includes improvement to replace
the Mad Mile section of the trail. The preliminary investigation and design is
currently carried out by HBRC and they indicated $50,000.00 as a local share
from the Council.
4.19 Middle
Road Improvements – Middle Road is promoted as part of the Heartlands
Ride New Zealand Cycle Trail and was previously accepted and supported by HDC.
However, the existing road environment (i.e. narrow carriageway, high heavy
vehicle volume and blind windy corners) creates an unsafe environment for
cyclists. Although there is a need to improve cycle safety along the route,
Middle Road is also identified as one of the high risk motorcycle route and has
few road sections that will be re-constructed as part of the Area Wide Pavement
Treatment (AWPT).
A
Middle Road Corridor Improvement plan is currently under investigation which
will combine all these projects and will provide a strategic vision for the
entire route to improve efficiency and safety for all road users. It is
expected that the corridor report will be completed over next two months and
will recommend few options for implementation over period of time (i.e. short
term, medium term and long term). Based on the high level preliminary
estimates, a provision of up to $600,000.00 is proposed to improve cycle safety
(only) over next three years.
4.20 Notwithstanding
the identified need to upgrade Middle Road, a question as to the appropriate
funding issue for cycling requirements needs to be developed.
4.21 Whirinaki
Road Improvements – This work is part of the HBRC’s long term
plan and will include a staged lime sand trail extension of 7 km from Bayview
Trail end to the Whirinaki/Pan Pac MTB Park. It is expected that this trail
will ultimately extend 4 km further to Tangoio Settlements. The HBRC is
currently investigating details for the trail and has indicated to allocate $100,000.00
as part of the local share. As with Middle Road the appropriate funding
will need to be developed.
4.22 Two
options were developed as part of implementing the proposed strategy. Option 1
proposed to deliver all identified projects over 15 years and Option 2 over 30
years.
4.23 At
the Works and Service Committee meeting on 22 August 2017, it was resolved to
accept proposed strategy and deliver all identified projects over the next
three years and the remaining projects over the following 12 years as part of
the Long Term Plan 2018-28 process.
5.0 SIGNIFICANCE
AND ENGAGEMENT
5.1 Whilst
no formal consultation with wider community is carried out, few workshops with
the Active Transport Group (ATG), an advisory panel comprised of Councillors
and representatives of Hawke’s Bay Regional Council, Napier City Council,
Hawke’s Bay District Health Board, Sport Hawkes Bay, Cycle Aware
Hawke’s Bay, Ramblers and the Youth Council were carried out.
5.2 The
involved level of participation with ATG was adopted. This was achieved by
engaging the Group in all stages such as project identification, project
prioritisation and encouraging them to provide comments on the process.
5.3 Although
the proposed iWay strategy including prioritised projects are thoroughly developed
in partnership with ATG, it is necessary to complete additional consultation
and engagement with other stakeholders and local community prior to
implementing any further work. The next stage of consultation will be project
specific and will align with the standard consultation process adopted by HDC
when delivering new capital project works on the roading network.
6.0 FINANCIAL
IMPLICATIONS
6.1 All
three identified projects are prioritised based on their regional priority and
their significance in NZ Cycle Trail. It is estimated that the local share for
identified improvements to
· Mad Mile section of Waimarama Road will cost up to $50,000.00;
· Middle Road safety improvement for cyclists only will cost nearly
$600,000.00 (this estimate will likely change after completion of the Middle
Road Corridor Plan); and
· Whirinaki Road Improvement will cost up to $100,000.00.
|
7.0 RECOMMENDATIONS AND
REASONS
A) That
the report of the Strategic Transportation
Engineer titled “iWay Strategy Update” dated 11/09/2017 be received.
B) That the Hastings District Rural Community Board endorse the I-Way
Strategy.
C) That the Hastings District Rural Community Board request that an
appropriate funding approach to cycleway improvements as identified in the
Strategy be developed.
With the reasons for this decision
being that the objective of the decision will contribute to meeting the
current and future needs of communities for good quality local
infrastructure.
|
Attachments:
|
1
|
Proposed i-Way Strategy ten year plan
|
TR-17-4-17-1
|
Separate Document
|
REPORT TO: Hastings
District Rural Community Board
MEETING DATE: Monday 11
September 2017
FROM: Chief Financial Officer
Bruce
Allan
SUBJECT: Draft
Financial result for the year ended 30 June 2017 for Rating Area 2
1.0 SUMMARY
1.1 The
purpose of this report is to inform the Hastings Rural Community Board (HRCB)
of the indicative rating result for the year ended 30 June 2017.
1.2 The
Council is required to give
effect to the purpose of local government as prescribed by Section 10 of the
Local Government Act 2002. That purpose is to meet the current and future needs
of communities for good quality local infrastructure, local public services,
and performance of regulatory functions in a way that is most
cost–effective for households and businesses. Good quality means
infrastructure, services and performance that are efficient and effective and
appropriate to present and anticipated future circumstances.
1.3 The
indicative result for Rating Area 2 for the 2016/17 year is favourable to
budget and is a $380,959 rating surplus. The results are unaudited and
indicative at this stage and consequently there may be some variation to the
figures in the final result.
1.4 This
report concludes by recommending that the Hastings Rural Community Board
recommend to the Finance and Monitoring Committee that the remaining rating
surplus after specific allocations is allocated to the Rural Flood and
Emergency Event Reserve.
2.0 CURRENT
SITUATION
2.1 The
unaudited result for the year ended 30 June 2017 will be presented to the Finance
& Monitoring Committee on 12 September 2017.
2.2 This
report sets out the indicative rating result for the year ended 30 June 2017
for Rating Area 2.
The Rating
Result
2.3 The
indicative rating result for the 2016/17 financial year is a positive result
for
Rating Area 2, a $380,959 surplus.
2.4 A
more detailed breakdown of this result is available in Attachment 1.
2.5 The
overall rating surplus is due to savings across a number of Council activities.
2.6 The
following graph demonstrates from what activities the surplus has accumulated:
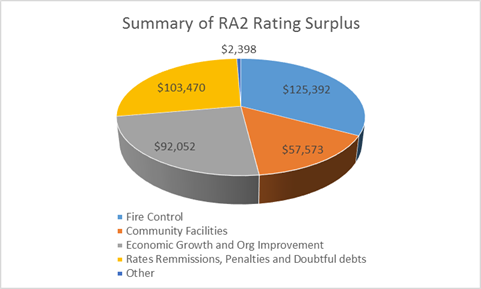
2.7 While
Transportation makes up over half of the rating requirement for RA2 with a
$5.3m net budget, the Transportation budget has been managed expertly with just
a $46 surplus and therefore doesn’t feature on the graph above.
2.8 The
largest single contributor of the RA2 surplus was Rural Fire where RA2
contributes 80% of the rating requirement. The level of rates remissions was
also lower than expected and has contributed to the surplus favourably.
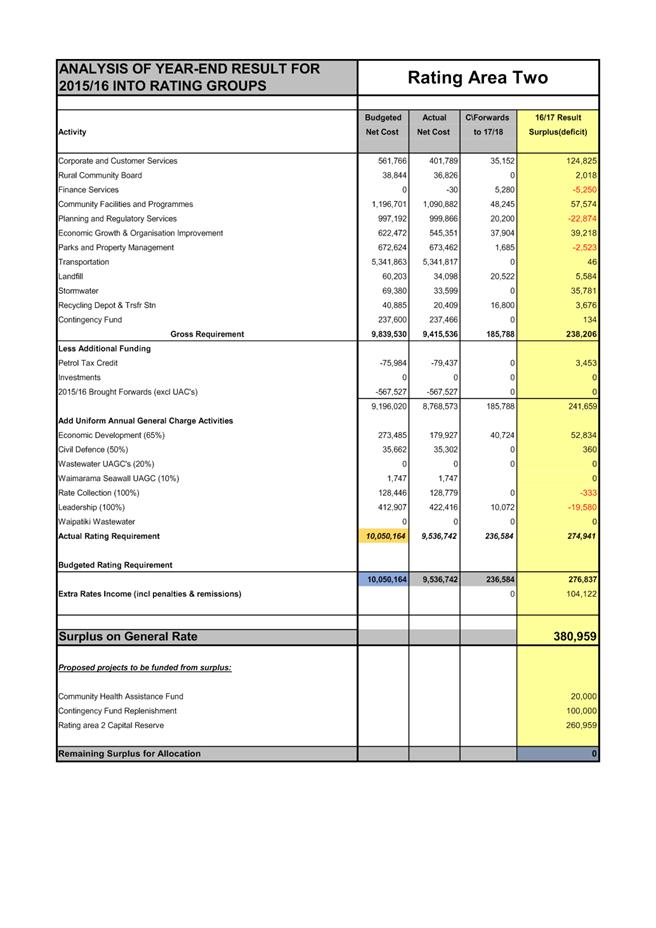
2.9 The
net rating result is shown in the attached schedule “Analysis of Year End
Result for 2016/17 for Rating Area 2”. This shows the budgeted and
actual cost for the various activities and the amount requested to be carried
forward. The final column shows the rating surplus or deficit (negative)
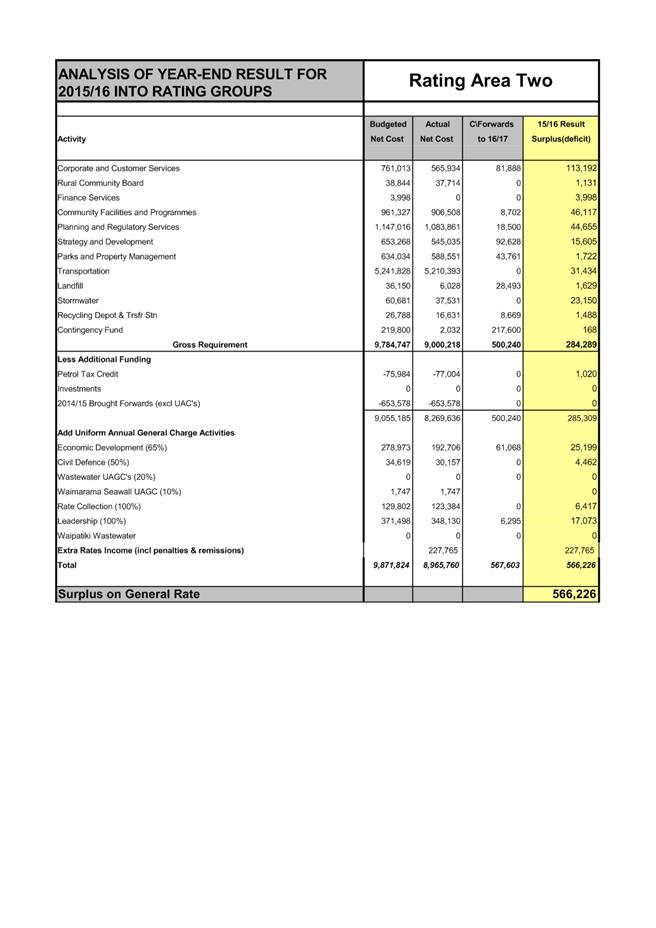
for the activities. Also attached as Attachment 2 is the 2015/16
result for comparison.
Rural Flood and Emergency Event Reserve
2.10 The
Rural Flood and Emergency Event Reserve has a balance of $1,785,603 as at 30
June 2017. The Hastings Rural Community Board on 21 September 2015 resolved:
“That the Hastings Rural Community Board recommend to Council
that a new target level for the Rural Flood and Emergency Event Reserve be
established of $2,000,000.”
2.11 The
above resolution was subsequently approved by Council.
2.12 Allocation
of Surplus
Council’s Treasury Policy states the
following on the allocation of surpluses:
“The funds from all asset sales
and operating surpluses will be applied to the reduction of debt and/or a
reduction in borrowing requirements, unless the Council specifically directs
that the funds will be put to another use.”
2.13 Rating
Area 2 currently has no debt with the Taihape Road debt being extinguished last
year from the 2016 surplus.
2.14 The
exact allocation of funds to reserve contributions may change if Council
determine that additional funds be set aside from the 2016/17 surplus to meet
any other identified needs. The Rating Area 2 surplus allocation will
only be affected by the relevant rating splits between Rating Area 1 and Rating
Area 2.
2.15 The
Rating Area 2 reserve balances as at 30 June 2017 are as follows:
2.16 Given
that Rating Area 2 has no debt, the Board can therefore only allocate the
surplus to increasing reserves including the Rural Flood and Emergency Reserve
or some other reserve for another purpose.
2.17 It
is recommended that $260,959 of the surplus, currently assessed at $380,959 be
allocated to the Rating Area 2 Capital Reserve. The actual amount will be
dependent on the allocation of the final surplus by the Finance and Monitoring
Committee on 12 September 2017.
2.18 The
balance of the Rating Area 2 surplus is allocated as its share of two other
surplus allocations with the replenishment of the Council contingency fund
being the primary driver. The Contingency Fund is allocated 80:20 between
Rating Area 1 and 2.
2.19 The
following table summarises the allocation of the 2016/17 Rating Area 2 surplus:
|
|
$
|
|
RA2 Surplus
on General Rate
|
380,959
|
|
Allocation
of Surplus:
|
|
|
Community Health
Assistance Fund
|
20,000
|
|
Contingency Fund
Replenishment
|
100,000
|
|
Rating Area Two
Capital Reserve
|
260,959
|
|
Allocated
Surplus
|
380,959
|
3.0 SIGNIFICANCE
AND CONSULTATION
3.1 This
decision is not significant in terms of the Council’s policy on
significance and no consultation is required.
|
4.0 RECOMMENDATIONS
AND REASONS
A) That
the report of the Chief Financial Officer titled “Draft
Financial result for the year ended 30 June 2017 for Rating Area 2”
dated 11/09/2017 be received.
B) That the Hastings Rural Community Board recommend to Council that
$260,959 of the Rating Area 2 Rating Surplus be allocated to the Rating Area 2 Capital Reserve.
|
Attachments:
|
1
|
Analysis of Rating Area 2 Year End Result for
2016/17
|
CG-14-26-00030
|
|
2
|
Analysis of Rating Area 2 Year End Result for
2015/16
|
CG-13-26-00098
|
|
Analysis of Rating Area 2 Year End
Result for 2016/17
|
Attachment 1
|
|
Analysis of Rating Area 2 Year End Result for
2015/16
|
Attachment 2
|
HASTINGS DISTRICT COUNCIL
Hastings District Rural Community
Board MEETING
Monday, 11 September 2017
RECOMMENDATION TO EXCLUDE THE PUBLIC
SECTION 48, LOCAL GOVERNMENT OFFICIAL INFORMATION AND
MEETINGS ACT 1987
THAT the public now be excluded from the
following part of the meeting, namely:
14. Public
Works Act - Former Clark's Quarry, Glengarry Road
The general
subject of the matter to be considered while the public is excluded, the reason
for passing this Resolution in relation to the matter and the specific grounds
under Section 48 (1) of the Local Government Official Information and Meetings
Act 1987 for the passing of this Resolution is as follows:
|
GENERAL SUBJECT OF EACH MATTER TO BE CONSIDERED
|
REASON FOR PASSING THIS RESOLUTION IN RELATION TO
EACH MATTER, AND
PARTICULAR INTERESTS PROTECTED
|
GROUND(S) UNDER SECTION 48(1) FOR THE PASSING OF EACH
RESOLUTION
|
|
|
|
|
|
14. Public
Works Act - Former Clark's Quarry, Glengarry Road
|
Section 7 (2)
(i)
The withholding
of the information is necessary to enable the local authority to carry on,
without prejudice or disadvantage, negotiations (including commercial and
industrial negotiations).
Withholding of
the information is necessary to enable the Council to carry out, without
prejudice or disadvantage, negotiations. Interests protected to enable
the Council to carry on, without prejudice or disadvantage negotiations
around seciton 48(1)(a)(i).
|
Section
48(1)(a)(i)
Where the Local
Authority is named or specified in the First Schedule to this Act under
Section 6 or 7 (except Section 7(2)(f)(i)) of this Act.
|